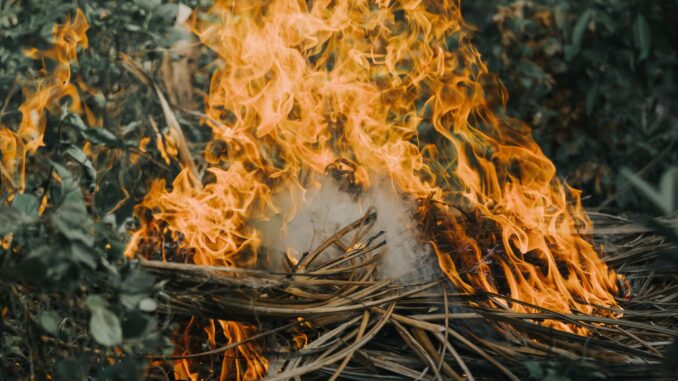
Photo by Nothing Ahead on Pexels
The most important information about a fast-moving wildfire usually exists, on a good day, 900 kilometers above the ground in the thermal-infrared sensors of a European government satellite. For decades, turning that raw signal into something a human being could act on — a map, an alert, a perimeter line — required either a professional remote-sensing analyst or a corporate budget large enough to license commercial imagery by the scene. Europe’s new move in the middle of its worst fire season on record collapses that gap. The Copernicus Browser, the EU’s free web-based satellite data viewer, has quietly added a wildfire layer that lets anyone, anywhere, watch the thermal signature of a fire in near-real time, no training or fee required.
That sounds like a modest interface change. It is not. The announcement, made public on August 7, 2026, comes as fire agencies from Portugal to Greece are fighting thousands of blazes that have already rewired seasonal records before the fires typically peak. In this kind of year, the difference between a useful wildfire product and a merely interesting one is measured in minutes and in who gets to click the link. The new layer turns a research-grade satellite system into a public safety tool.
Copernicus Browser now puts a live fire layer in anyone’s hands
The Copernicus Browser is not new. It has been the standard free gateway to the imagery collected by the European Union’s Sentinel satellites since 2022, letting users browse visible, infrared and radar views of the planet. What is new, and what happened this week, is a purpose-built wildfire visualization on top of that catalog. Users can switch to the wildfire view and immediately see active fire detections as bright points over a natural-color geography, updated multiple times per day.
The practical effect is profound for a wildfire season like 2026’s. Instead of searching for a CSV file of fire detections and teaching oneself to render it, a resident of a burning district or a local councillor in a region without a dedicated GIS specialist can open a browser tab and see where the fires are, roughly how intense they are, and where the leading edges might be pushing. That is the kind of capability that normally exists only inside national emergency operation centers.
Copernicus scientists have framed the layer as a response to user demand, not a fresh research initiative. The browser’s user base has grown rapidly over the past two years, largely driven by people who do not identify as Earth-observation specialists but who need answers during emergency events. This is the first major step in making Copernicus’s fire detection capability feel like a consumer product: clean, legible and fast.
The science that makes a satellite see a fire
Understanding why this is a genuinely hard problem matters. Satellites cannot see smoke in the way a human on a hilltop sees it. Instead, the Copernicus system relies on thermal infrared bands on board the Sentinel-3 satellites, which scan the planet in a swath wide enough to pass over a region nearly every day. Those sensors record radiation in wavelengths invisible to the human eye. A wildfire emits a dramatic spike in those bands — not the small warmth of a hot rooftop, but a distinct, saturated anomaly that stands out against cooler ground.
The new wildfire layer takes those raw thermal readings and combines them with the rest of the browser’s infrastructure to produce an interpreted product. Each fire pixel is identified as a sudden, sustained heat anomaly relative to its surroundings. Adjacent pixels are clustered into fire fronts. The colors on the map are not real colors; they are intelligently designed false colors that show heat intensity, sometimes with the most severe active fronts in red or orange while recently burned areas fade to a secondary shade.
That may sound like a minor technical detail, but it is the entire difference between “fire data” and “fire information.” A raw thermal file is a list of numbers that requires considerable knowledge to interpret. The Copernicus Browser layer is the interpretation, automated and wrapped in a familiar map interface. It is a subtle shift, but it means the technical threshold to act on the imagery has fallen to almost zero.
Who this is for, from dispatch centers to concerned neighbors
Professional wildfire managers will continue to use specialized, higher-resolution tools, many of them commercial. But the new Copernicus layer fills a real gap for the enormous middle tier of users who need dependable, current fire location data without building their own processing pipeline. That includes university labs tracking fire ecology, regional environmental agencies, volunteer fire brigades, and NGOs documenting the effects of fire on rural and peri-urban communities.
It also includes ordinary citizens. In a season like this one, residents of vulnerable villages are making high-stakes decisions — whether to evacuate, where to drive, which relatives to warn — on the basis of rumor and official announcements that can lag behind a fire’s actual movement. A free browser layer showing where the fire was detected in the last few hours, cross-checked against smoke plumes visible in the satellite imagery, adds a factual anchor to those decisions. It will not replace evacuations, but it can give people a clearer mental model of where danger is and where it is not.
Journalists, too, are quietly an important audience. The wildfire layer lets newsrooms verify official claims about fire locations and independently report the scale of an event without needing to negotiate for aerial survey flights. The public record of what burned in 2026 will be richer because of this.
The free-data advantage over commercial satellite fleets
Commercial Earth-observation providers have done excellent work in the wildfire space, offering very high-resolution imagery that can outline a burned house or a single fire truck. But that capability is expensive, often triggered only after a major fire gets government attention, and the imagery, once delivered, is not always made public. Copernicus’s offering is the opposite: universally accessible, free, and built on a programmatic commitment to open data.
Major wildfire tracking tools compared
| Service | Operator | Cost to public | Typical resolution |
|---|---|---|---|
| Copernicus Browser (new fire layer) | European Union | Free | ~300m thermal (Sentinel-3) |
| FIRMS | NASA | Free | ~375m (VIIRS) / ~1km (MODIS) |
| EFFIS | EU / CEMS | Free | Derived products, national data |
| Planet Fire Monitoring | Planet Labs | Commercial | 3–5m optical |
| Maxar Rapid Response | Maxar Technologies | Commercial | 0.3–0.5m optical |
The closest comparable tools have been NASA’s Fire Information for Resource Management System (FIRMS) and the European Forest Fire Information System (EFFIS), both of which have been invaluable for researchers. What the Copernicus Browser does differently is integrate the fire detection layer into the same environment where a user can then browse the underlying scenes, inspect burned-area products, and even download the exact data behind the visualization. It closes the loop between “look at the map” and “understand what you are seeing.”
The table below offers a simplified comparison of major wildfire tracking tools now available, illustrating how the public options stack up alongside commercial services.
Privacy, environmental justice, and the price of watching fires
Satellite surveillance has a well-earned reputation problem. The same instruments that spot wildfires can also spot agricultural activities, migration patterns, even the heat signatures of buildings and vehicles. European privacy advocates have expressed concern about the expansion of openly available satellite intelligence being used for civilian monitoring. The fire layer does not change what Sentinel-3 sees — it only changes how easily the thermal data can be interpreted — but the ease-of-use improvements are, by design, democratizing a form of overhead observation.
In the case of wildfires, that trade-off is strongly weighted toward the public good. Fires do not have a reasonable expectation of privacy, and knowing where they are burning is a matter of life and property. More importantly, open access to fire detection has an environmental justice dimension. Communities that are economically marginalized are often exactly the ones that cannot afford expensive commercial fire-tracking services and are most exposed to the effects of climate-driven fires. A free, authoritative layer gives those communities a seat at the table in planning, recovery, and public argument about fire risk.
Economically, the implications extend far beyond the emergency operations room. Insurance companies calculating wildfire risk, agricultural businesses protecting seasonal assets, and logistics companies rerouting supply chains around fire zones are already using satellite-derived fire data — and paying for it. The Copernicus layer does not eliminate that market, but it puts a strong floor of free, reliable information beneath it. That alone will force commercial providers to compete on speed and resolution rather than on basic access, a healthy pressure in a rapidly warming world.
Where Europe takes this next
This release is best understood as an acknowledgment of a coming shift: wildfire monitoring is no longer a niche scientific activity but a core public service. The Copernicus constellation is already evolving, with plans for increased thermal resolution and more frequent revisit times in the next generation of Sentinel satellites. The machine-learning community has been waiting for exactly this kind of accessible data to train better predictive fire models, and a browser layer that exposes detections in an easily parsed format is fertile ground for rapid algorithmic development.
The more significant development here may be institutional rather than technological. By treating wildfire tracking as a basic right of every European citizen, the EU is setting a precedent that other climate hazards might follow. Flooding, drought, and extreme heat events all have satellite signatures. If Copernicus can make fire this legible, the same user-centered redesign could be applied to a dozen other hazards. The wildfire layer, in other words, may be remembered less as a feature addition than as the moment Europe’s climate crisis communication became visual, public, and free.
Editorial Note: This article was produced with AI assistance and reviewed by the Celloraa editorial team for accuracy and clarity. It is intended for informational purposes only.
Read our Editorial Policy.
Leave a Reply